Official Land Prices of Japan in 2022 – Tokyo’s prices see increase for the first time in 2 years both in Commercial Areas and Residential Areas
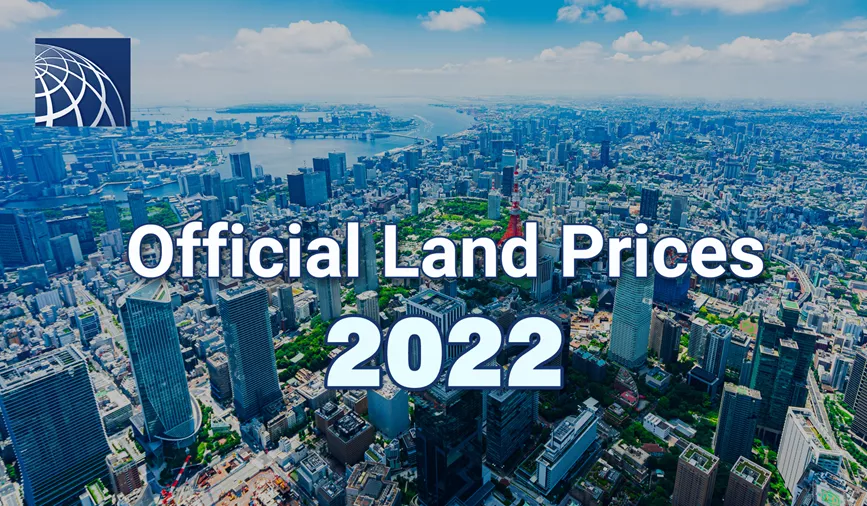
On March 22, 2022, the Ministry of Land, Infrastructure, Transport, and Tourism announced the official land prices as of January 1, 2022. The data for 2022 shows a 0.6% increase nationwide in the fluctuation of the average prices for all types of land zoning, which is an increase for the first time in 2 years and reflects a gradual economic recovery from the coronavirus disaster. In “Commercial areas”, while still affected by the coronavirus disaster, the national average land price fluctuation started to rise by 0.4%, and also in “Residential areas” the same price fluctuation rose by 0.5% due to the expansion of teleworking and increase in housing demand in the city center, as well as in the suburbs.
The 2022 average land price for Tokyo has seen a start of increasing fluctuations from 2021 in all areas of zoning for the first time in 2 years, which include increase of 0.6% in Commercial areas, 1.0% in Residential areas, and 0.9% in the average fluctuation of all the areas of zoning.
The average fluctuation in the land price for Tokyo's Commercial areas has seen rise of 0.6%. The average rate of increase across the 23 wards was 0.7%, including the highest increase in Nakano-ku (2.3%), followed by Suginami-ku (2.1%), and Arakawa-ku (2.0%). On the other hand, the 3 ward of Central Tokyo had a decrease fluctuation, including the largest decrease in Chuo-ku (-1.3%), followed by Chiyoda-ku (-1.2%), and Minato-ku (-0.3%).
Looking at the top five Commercial areas with the highest rate of increase, the two land points in Nakano 3-chome marked 4.5% and 4.3% respectively, followed by the land points in Nakano 5-chome (4.2%), Senju 2-chome (4.0%), and Senju Asahicho (3.7%). All these points are the locations outside Yamanote Line and are the commercial areas that are easily accessible for everyday shopping from the nearby residential areas. In particular, the area around Nakano Station, where redevelopment is in progress, is expected to improve convenience, and the price rise seems to be accelerated. An official of Tokyo Metropolitan Government explains that there is a growing trend for people to shop in the stores around their residential areas rather than the commercial areas in Central Tokyo.
On the other hand, the prices in the 3 wards of Central Tokyo continued to decline, although the rates of declining are less than those in the previous year, the Ginza and Yurakucho area stand out among other areas, including the largest decline in Ginza 8-chome (-5.6%), followed by Yurakucho 1-chome (-4.8%) and Ginza 6-chome (-3.8%). About the situation an official of Tokyo Metropolitan Government explains that the coronavirus disaster has been prolonged, foreign visitors have not come to Japan for a long time, and visitors for shopping and tourism remain far away from Central Tokyo, while the office market is uncertain, and the vacancy rate is expanding.
This year’s official land price ranking for commercial properties (shown below) shows that all the top 10 highest price points in Japan are properties located within Tokyo. This year Ginza, in Chuo-ku, is in possession of 6 of the top 10 land points, including the top 4 points on the highest land price list, with its Yamano Music Ginza Main Store taking first place. However, it has been observed that, with regard to fluctuations, the large rates of decline are conspicuous in Ginza, Chuo-ku.
The average fluctuation in the land price for Tokyo's Residential areas sees rise by 1.0%, which is higher than that in Commercial areas. In all Tokyo’s 23 wards the average price fluctuation rose, including the highest increase shown in Chuo-ku (2.9%), followed by in Toshima-ku (2.6%) and Bunkyo-ku (2.5%). In the 5 wards in Central Tokyo (Chiyoda, Chuo, Minato, Shinjuku, and Shibuya) the average price fluctuation rose by 2.2% while other wards rose 1.4%. According to an official of the Tokyo Metropolitan Government, “these results are due to the people’s review of their living environment based on the spread of teleworking, and the high demands mostly among wealthy people for condominiums in the city center and neighboring wards.”
The highest rate of increase was marked in Ebisu Nishi 2-chome (5.9%) which is close to Daikanyama Station, followed by in Toyosu 4-chome (5.5%), and Shinjuku-ku Minamimotomachi (5.3%), which are the locations around the stations close to Central Tokyo or convenient for everyday shopping.
The 2022 official land price ranking for residential properties (shown below) shows that 5 of the highest land prices in Japan are within Tokyo’s borders. The most expensive place is “1-14-11, Akasaka” in Minato-ku at 5 million yen per 1 square meter, making it the highest land price point for the 5th consecutive year, and its increase was 3.3% from 2021. This 3.3% increase is larger increase than in 2021, the highest in the top 10 price points, and outdistanced the second highest. It is considered that demands from high-income people, who are deemed to have been less affected by the corona disaster, have propped up the price levels in the areas with high land prices.
(Reference: 2022/03/22 NIKKEI Newspaper, Tokyo Shimbun)
2022 Official Land Price Ranking by Property Nationwide
(Commercial Properties)
| Ranking | All 10 are in Tokyo | JPY/sq.m | Fluctuation (% from 2021) |
|---|---|---|---|
| 1 | 4-5-6, Ginza, Chuo-ku (Main store of Yamano Music Co.) |
53,000,000 | - 1.1 |
| 2 | 5-4-3, Ginza, Chuo-ku (Taikakukan Building) |
45,500,000 | - 1.3 |
| 3 | 2-6-7, Ginza, Chuo-ku (Meidi-ya Ginza Building) |
39,100,000 | - 2.0 |
| 4 | 7-9-19, Ginza, Chuo-ku (ZARA) |
38,200,000 | - 2.8 |
| 5 | 2-4-1, Marunouchi, Chiyoda-ku (Marunouchi Building) |
36,700,000 | - 1.3 |
| 6 | 3-24-1, Shinjuku, Shinjuku-ku (Shinjuku M-SQUARE) |
36,300,000 | - 0.5 |
| 7 | 3-30-11, Shinjuku, Shinjuku-ku (Shinjuku Takano Building No.2) |
34,500,000 | - 0.3 |
| 8 | 2-2-1, Otemachi, Chiyoda-ku (Shin-Otemachi Building) |
28,800,000 | - 0.7 |
| 9 | 6-8-3, Ginza, Chuo-ku (Ginza Owaricho TOWER) |
28,200,000 | - 3.8 |
| 9 | 4-2-15, Ginza, Chuo-ku (Tsukamoto Soyama Building) |
28,200,000 | - 1.7 |
2022 Official Land Price Ranking by Property Nationwide
(Residential Properties)
| Ranking | All 5 are in Tokyo | JPY/sq.m | Fluctuation (% from 2021) |
|---|---|---|---|
| 1 | 1-14-11, Akasaka, Minato-ku | 5,000,000 | 3.3 |
| 2 | 6-1, Rokubancho, Chiyoda-ku | 4,150,000 | 2.5 |
| 3 | 3-16-10, Shirokanedai, Minato-ku | 3,880,000 | 1.8 |
| 4 | 4-9-34, Minami-Azabu, Minato-ku | 3,650,000 | 2.2 |
| 5 | 1-5-11, Minami-Azabu, Minato-ku | 3,250,000 | 2.5 |
(Source: 2022/03/22 NIKKEI Newspaper)
What is Official Land Price?
Based on the Public Notice of Land Prices Act, the Land Appraisal Committee of the Ministry of Land, Infrastructure, Transport and Tourism selects the points of land, evaluates the price of each point of land as of January 1st every year, and announce it as a benchmark price for land transactions. The total selected points of land in Tokyo as of year 2021 are 2,602 points; the number of points per each purpose are 1,705 points for residential areas, 850 points for commercial areas, and 39 points for industrial areas, 8 points for forest lands, respectively.

- Rental Apartments & Houses in Tokyo
- Listings of popular and luxurious rental apartments, condominiums, and houses designed with expats in mind.

- Apartments & Houses for Sale in Tokyo
- Listings of apartments, condominiums, and houses available for purchase in Tokyo.
