Poverty Situation in Japan: Reality and Challenges

While Japan may appear prosperous from overseas, according to the "OECD Economic Survey (2017)" Japan's relative poverty rate is the second-highest among the G7 countries, following the United States. The poverty situation in Japan is severe, with many people facing poverty. This reality becomes evident when considering the relative poverty rate and the number of individuals receiving social welfare benefits. Poverty has intensified not only in elderly households and households with individuals who are ill or disabled but also in households with children, such as single-parent households. The impact of poverty is particularly reflected in the limited access to meals, affecting the number of breakfasts and lunches for children. This article summarizes the current reality of Japan's poverty situation.
Tokyo's Public Assistance Rate
According to the Welfare and Hygiene Statistical Yearbook (2021 edition), the number of households receiving public assistance in Tokyo is 231,751 (out of a total of 7,354,402 households), with a total of 280,496 individuals (out of a total population of 13,794,933). The public assistance rate, which is the ratio per thousand people in the population, is 20%.
When considering household types, among single-person households, the highest proportion is elderly households at 50.4%, followed by households with illness, injury, or disability at 22.2%. Among households with two or more members, elderly households account for 4.2% and single-parent households account for 3.6%. When comparing single-person households and households with two or more members, single-person households make up the majority at 84.6%
Relative Poverty Rate in Japan
The "relative poverty rate" refers to the proportion of household members whose equivalent disposable income (the household's disposable income divided by the square root of the number of household members) falls below the poverty line (which is half the median). Disposable income refers to income after deducting income tax, social insurance premiums, resident tax, and fixed asset taxes. It does not include in-kind benefits from social security payments, such as childcare services, or assets.
Relative Poverty Rate in Japan
Here is a quote from the Ministry of Health, Labour and Welfare's publication 'Household Situation in Graphs.' The relative poverty rate in Japan from 1985 to 2018 is shown, with the relative poverty rate being 15.4% in 2018. According to the 2022 National Survey of Family Income, Income Situation of Various Households, the poverty line (half of the median equivalized disposable income) in 2021 was 1.27 million yen.
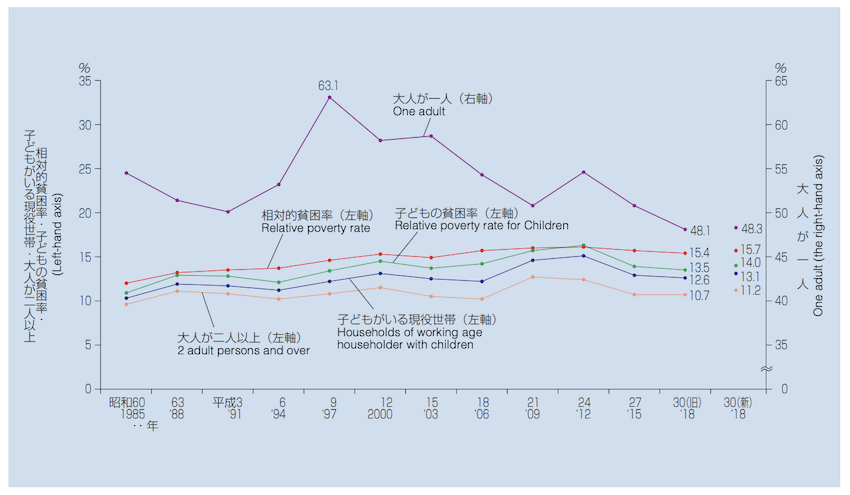
相対的貧困率については、厚労省の資料に以下のように記載されています。
Regarding the relative poverty rate, the Ministry of Health, Labour and Welfare provides the following description:
"The Ministry of Health, Labour and Welfare has published the 'relative poverty rate,' which is calculated based on the OECD's (Organisation for Economic Co-operation and Development) criteria (the percentage of individuals with disposable income below half the median equivalent disposable income). This relative poverty rate is calculated using data from the National Survey on Family Income and Expenditure. The calculation involves: (1) calculating 'equivalent disposable income,' (2) arranging 'equivalent disposable income' in ascending order, (3) determining the 'median,' (4) calculating the 'poverty line,' and (5) identifying individuals who fall below the 'poverty line' (those whose equivalent disposable income falls below a certain threshold) as 'relatively poor.'
It is important to note that this calculation method focuses solely on income and does not consider in-kind benefits or assets. Therefore, it is necessary to be aware that even individuals who have substantial savings or own properties may be categorized as 'poor' if their income is low. However, the 'relative poverty rate' remains a meaningful indicator for capturing 'poverty' from an income perspective.
Now, how can we improve the 'relative poverty rate'? Since the 'relative poverty rate' compares the equivalent disposable incomes of households in a given country, increasing everyone's equivalent disposable income by the same amount will have little impact on the 'poverty rate.' Similarly, if only individuals with higher incomes experience income growth, income inequality will widen, but the 'poverty rate' will remain unchanged. Conversely, reducing the number of individuals with incomes below the poverty line and increasing their incomes will lead to a lower 'relative poverty rate.' However, it should be noted that whether individuals considered 'relatively poor' in Japan can be classified as 'poor' on a global scale cannot be determined by a simple numerical comparison."
The Poverty Situation in Japan
Here is an overview of the poverty situation in Japan based on data compiled by the Ministry of Health, Labour and Welfare. The following information is sourced from the "Graphs illustrating household conditions from the National Survey on Family Income and Expenditure."
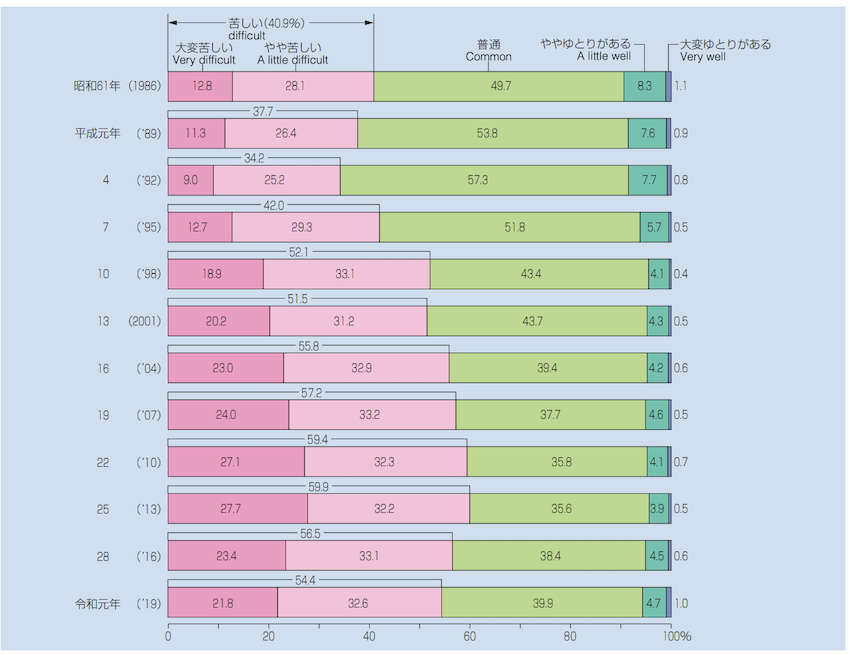
Annual Changes in the Composition Ratio of Households by Livelihood Consciousness
This data reflects the livelihood consciousness of Japanese people. In 2019, the percentage of Japanese people who perceived their livelihood as "difficult" (combining "very difficult" and "a little difficult") rose to 54.4%.
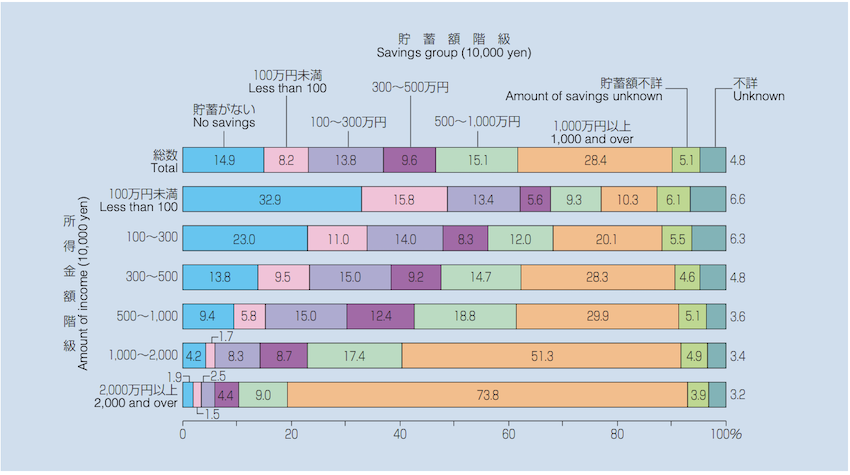
Presence of Savings by Income Class - Composition Ratio of Households by Savings Amount Groups
In 2019, the percentage of households without savings was 14.9% of the total.
- *Regarding savings, the data reflects the current balance as of the end of June 2019, while income data pertains to the year 2019.
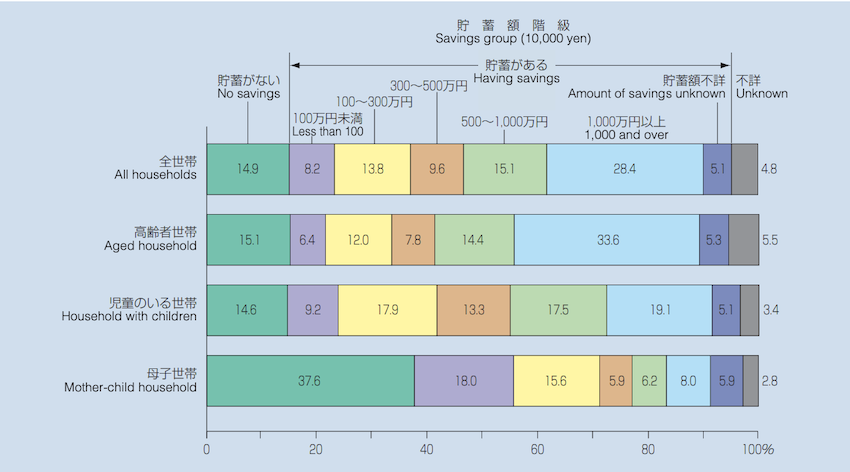
Savings by various household types − Percentage of households by savings class
In particular, it is evident that the percentage of mother-child households without savings is more than twice that of other households.
*Regarding savings, the data reflects the balance as of the end of June 2019.
Child poverty situation
Poverty is also a problem for families with children in Japan. Families face challenges such as being unable to afford school lunches, lacking funds to provide lunch during summer or winter vacations, struggling to prepare three meals a day, and facing difficulties in supporting their children's education.
The graph below shows the current living situation, broken down by income and by household (taken from the Cabinet Office 2021 Analysis of Children's Living Conditions Survey report).
The proportion of households with the lowest income level of less than one-half of the median (below the poverty line) who answered that their living situation was 'difficult' or 'very difficult' was 57.1%, 51.8% for single-parent households as a whole and 53.3% for single-mother households only.
Living conditions by income and household

According to the analysis from the Cabinet Office's survey on children's living conditions, households with lower income levels and single-parent households tend to experience higher levels of inability to afford food, clothing, and public utilities. In Japan as a whole, the percentage of people who reported experiencing the inability to buy food was 11.3%. However, among households with incomes below half of the median income, this percentage rises to 37.7%. For single-parent households as a whole, it was 30.3%, and for mother-child households specifically, it was 32.1%.
Regarding the percentage of people who experienced the inability to buy clothing, it was 16.3% for the entire country. However, among households with incomes below half of the median income, this percentage rises to 45.8%. For single-parent households as a whole, it was 38.9%, and for mother-child households specifically, it was 41.0%.
Experiences of not being able to buy food
Regarding the experience of not being able to afford necessary food (excluding non-essential items) within the past year, the overall percentage of "often," "sometimes," or "rarely" experienced cases was 11.3%. However, when looking at this combined percentage based on equivalent household income, households with incomes below half of the median income showed a rate of 37.7%. When considering different household situations, two-parent households reported a rate of 8.5%, whereas single-parent households as a whole reported 30.3%, and mother-child households specifically reported 32.1%.
By level of equivalent household income

By household status

Children's dietary situation.
The analysis report of the survey on children's living conditions provides information about the frequency of children's meals. For breakfast, the percentages were as follows: "Every day" 82.0%, "5-6 days a week" 10.3%, "3-4 days a week" 2.8%, and "1-2 days a week or hardly eat" 4.6%. As for dinner, "Every day" accounted for 97.9%. During periods like summer or winter vacations, the percentage of children who eat lunch "Every day" was 89.1%, and "1-2 days a week or hardly eat" was only 0.6%.
When examining the data based on equivalent household income levels, households with incomes below half of the median income showed lower percentages of "Every day" for breakfast (71.2%) and "Every day" for lunch during vacation periods (82.4%) compared to other households. Among different household types, single-parent households reported "Every day" for breakfast at 70.2% and "Every day" for lunch during vacation periods at 83.2%, both of which were lower than two-parent households.
Future Challenges
The poverty situation and income inequality in Japan are severe, particularly for elderly individuals, single-parent households, and mother-child households, where poverty levels are notably high. Some households face difficulties in purchasing food and clothing, and in terms of children's meals, the number of breakfasts and lunches is also affected, with households in poverty also having lower dietary sufficiency.
To improve the relative poverty rate, it is essential to reduce the number of individuals with incomes below the poverty line. Although there are volunteer groups such as Food Banks, solving the issue of poverty requires comprehensive policies, including narrowing income disparities, strengthening social security systems, and enhancing education and employment opportunities. Collaborative efforts from individuals, businesses, and society as a whole may be necessary to address the problem of poverty effectively.