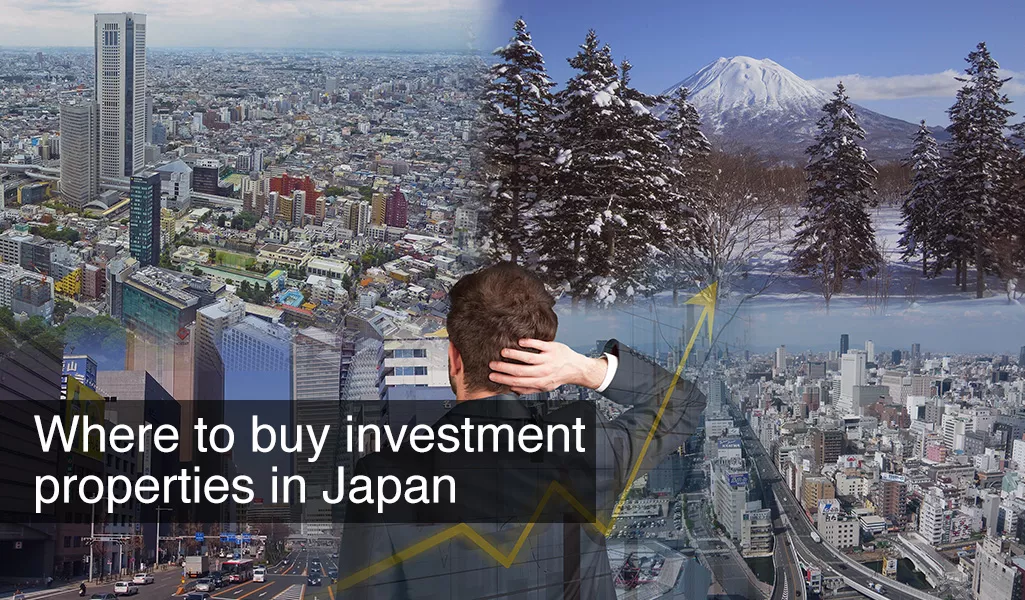
Property Investment For Foreigners: Where to Buy
The following is an excerpt from "Japan Real Estate Property Investment For Foreigners Part 2" by Ziv Nakajima-Magen – Partner & Executive Manager, Asia-Pacific Nippon Tradings International (NTI)
Japan’s current prime minister, Shinzo Abe, has taken some serious steps aimed at re-introducing healthy inflation, forcibly pushing down the value of the Japanese yen to improve exports, and tackling various monopolies, public funds management problems, declining wages and Japan's severe lack of entrepreneurship spirit.
In spite of this, however, the future of Japan's economy, although better than it has been for the last two decades - is still very uncertain, for the reasons discussed in the previous Q & A chapters.
What this means for us, as property investors, is that, if we are to look at the last three decades as a general benchmark, it would seem prudent to focus on stable, reliable monthly cash-flow as our prime criteria - and consider any potential capital appreciation to be a bonus, or icing on the portfolio cake - rather than bank on growth to any significant degree. This is the strategy we have been pursuing in our own personal property portfolios, as well as the one we have been advocating to our clients as a company.
Based on this strategy, we would therefore advise to "go against the herd", and avoid over-heated, internationally renown locations in Japan, in which hordes of foreign investors have been purchasing over the last few years. This means that, aside from some very unique cases, we would normally not recommend properties in central Tokyo, Osaka, Niseko (in the country's northern ski Mecca of Hokkaido), and central Okinawa (where many of Japan's US army bases and its personnel are located). If we also take into consideration the declining population, it would seem wise to carefully review population figures as well, to ensure a lasting and stable tenant base for years to come. All of this leaves us with two main location profiles in which we find ourselves most profitably and reliably active as investors –
"Second tier" metropolitan centres such as Nagoya, Sapporo, Fukuoka, Kawasaki and Yokohama
While returns vary in these locations from 5-12% net pre-tax per annum, some of these cities also offer good capital growth potential - Fukuoka city, for instance, has enjoyed property price rises very similar to Tokyo in the last four years. Sapporo city, which has been rising in price more slowly, still offers very high returns, which is quite rare for such a large city (Japan's fourth in size population-wise). The yield in other 2nd tier cities fall somewhere in between the two - but all of them feature a diverse economy of either blue collar industries (manufacturing, export/import, logistics and factories etc), white collar industries (academic, professional services, tourism etc) or a healthy mix of both.
Smaller, or otherwise less known towns and cities which, for some reason or another, also enjoy a stable or growing population and a bustling economy
Some examples include Kumamoto (solar industry), Sagamihara (construction), large ports such as various towns in and around Chiba, Kobe, and regional/internal tourism centers such as Matsuyama, the largest city in the Shikoku landmass, or Kitakyushu (western Japan's industrial hub, with a population of close to a million people). The list of these promising smaller townships with growing or stable population, as you can see in the first few pages of the population growth chart below, is quite substantial – just bear in mind that, in cases of cities where growth appears to be in the double or triple digits, this is more often the result of smaller towns having been officially amalgamated into their larger neighbours in re-zoning operations – so actual “real” population growth numbers should be reviewed prior to any decisions being made (English translation source: “Wikipedia”) -
City Population growth in Japan 2008 - 2015
| City (Japanese) |
City (English) |
Population 2008* (*Hokkaido - 2012) |
Population 2015 |
Growth by numbers |
Growth % |
|---|---|---|---|---|---|
| 久喜 | Kuki | 71,667 | 154,694 | 83,027 | 115.85% |
| 村上 | Murakami | 30,197 | 64,617 | 34,420 | 113.98% |
| 栃木 | Tochigi | 81,601 | 164,066 | 82,465 | 101.06% |
| 加須 | Kazo | 67,862 | 114,963 | 47,101 | 69.41% |
| 西尾 | Nishio | 106,643 | 170,159 | 63,516 | 59.56% |
| 八女 | Yame | 42,241 | 67,245 | 25,004 | 59.19% |
| 印西 | Inzai | 60,280 | 93,722 | 33,442 | 55.48% |
| 美祢 | Mine | 17,355 | 26,584 | 9,229 | 53.18% |
| 長浜 | Nagahama | 83,555 | 121,818 | 38,263 | 45.79% |
| 湖西 | Kosai | 44,545 | 61,195 | 16,650 | 37.38% |
| 日南 | Nichinan | 43,264 | 56,633 | 13,369 | 30.90% |
| 真岡 | Moka | 66,705 | 81,311 | 14,606 | 21.90% |
| 出雲 | Izumo | 146,115 | 174,731 | 28,616 | 19.58% |
| 近江八幡 | Omihachiman | 69,116 | 82,498 | 13,382 | 19.36% |
| 焼津 | Yaizu | 120,331 | 143,008 | 22,677 | 18.85% |
| 小林 | Kobayashi | 40,514 | 48,088 | 7,574 | 18.69% |
| 清須 | Kiyosu | 56,635 | 66,707 | 10,072 | 17.78% |
| つくばみらい | Tsukubamirai | 41,957 | 49,024 | 7,067 | 16.84% |
| 豊川 | Toyokawa | 161,595 | 185,111 | 23,516 | 14.55% |
| 藤枝 | Fujieda | 129,637 | 146,725 | 17,088 | 13.18% |
| 豊見城 | Tomigusuku | 54,586 | 61,658 | 7,072 | 12.96% |
| 守谷 | Moriya | 57,793 | 64,894 | 7,101 | 12.29% |
| 戸田 | Toda | 118,591 | 132,880 | 14,289 | 12.05% |
| 吉川 | Yoshikawa | 63,050 | 69,871 | 6,821 | 10.82% |
| 富士宮 | Fujinomiya | 122,122 | 135,034 | 12,912 | 10.57% |
| 流山 | Nagareyama | 156,686 | 172,659 | 15,973 | 10.19% |
| 合志 | Koshi | 53,490 | 58,873 | 5,383 | 10.06% |
| 宮崎 | Miyazaki | 369,473 | 405,750 | 36,277 | 9.82% |
| 白井 | Shiroi | 57,151 | 62,761 | 5,610 | 9.82% |
| 高崎 | Takasaki | 341,838 | 375,341 | 33,503 | 9.80% |
| 熊本 | Kumamoto | 670,348 | 734,917 | 64,569 | 9.63% |
| 木津川 | Kizugawa | 66,783 | 73,095 | 6,312 | 9.45% |
| 常滑 | Tokoname | 52,837 | 57,780 | 4,943 | 9.36% |
| 名取 | Natori | 69,610 | 76,107 | 6,497 | 9.33% |
| 八潮 | Yashio | 78,601 | 85,572 | 6,971 | 8.87% |
| 守山 | Moriyama | 74,263 | 80,684 | 6,421 | 8.65% |
| 富士 | Fuji | 237,279 | 257,697 | 20,418 | 8.61% |
| 沖縄 | Okinawa | 128,421 | 139,181 | 10,760 | 8.38% |
| 栗東 | Ritto | 62,353 | 67,284 | 4,931 | 7.91% |
| ふじみ野 | Fujimino | 103,724 | 111,920 | 8,196 | 7.90% |
| 鳥栖 | Tosu | 66,842 | 72,032 | 5,190 | 7.76% |
| 木更津 | Kisarazu | 123,743 | 133,064 | 9,321 | 7.53% |
| 日進 | Nissin | 80,921 | 86,962 | 6,041 | 7.47% |
| 香芝 | Kashiba | 72,967 | 78,297 | 5,330 | 7.30% |
| 稲城 | Inagi | 80,772 | 86,594 | 5,822 | 7.21% |
| 福津 | Fukutsu | 55,123 | 59,091 | 3,968 | 7.20% |
| 志木 | Shiki | 68,531 | 73,443 | 4,912 | 7.17% |
| 大府 | Obu | 83,097 | 89,049 | 5,952 | 7.16% |
| 糸満 | Itoman | 56,171 | 60,128 | 3,957 | 7.04% |
| 南城 | Nanjo | 39,458 | 42,178 | 2,720 | 6.89% |
| 前橋 | Maebashi | 318,058 | 339,956 | 21,898 | 6.88% |
| 松本 | Matsumoto | 227,392 | 242,446 | 15,054 | 6.62% |
| 川口 | Kawaguchi | 552,883 | 589,205 | 36,322 | 6.57% |
| 四街道 | Yotsukaido | 85,738 | 91,340 | 5,602 | 6.53% |
| うるま | Uruma | 114,087 | 121,521 | 7,434 | 6.52% |
| 高浜 | Takahama | 43,467 | 46,295 | 2,828 | 6.51% |
| 牛久 | Ushiku | 79,254 | 84,378 | 5,124 | 6.47% |
| つくば | Tsukuba | 207,314 | 220,622 | 13,308 | 6.42% |
| 船橋 | Funabashi | 586,762 | 622,988 | 36,226 | 6.17% |
| 三郷 | Misato | 128,956 | 136,798 | 7,842 | 6.08% |
| 宜野湾 | Ginowan | 91,233 | 96,663 | 5,430 | 5.95% |
| 東大和 | Higashiyamato | 81,445 | 86,162 | 4,717 | 5.79% |
| 箕面 | Minoh | 127,757 | 135,153 | 7,396 | 5.79% |
| さいたま | Saitama | 1,192,418 | 1,260,879 | 68,461 | 5.74% |
| 浦添 | Urasoe | 108,052 | 114,245 | 6,193 | 5.73% |
| 朝霞 | Asaka | 126,902 | 134,132 | 7,230 | 5.70% |
| 大野城 | Onojo | 94,037 | 99,352 | 5,315 | 5.65% |
| 東海 | Tokai | 106,708 | 112,694 | 5,986 | 5.61% |
| 武蔵村山 | Musashimurayama | 68,333 | 72,092 | 3,759 | 5.50% |
| 東京都 特別区部 | Tokyo (main wards) | 8,637,098 | 9,102,598 | 465,500 | 5.39% |
| 島田 | Shimada | 95,762 | 100,921 | 5,159 | 5.39% |
| 宝塚 | Takarazuka | 222,071 | 234,003 | 11,932 | 5.37% |
| 成田 | Narita | 124,773 | 131,418 | 6,645 | 5.33% |
| 葛城 | Katsuragi | 35,194 | 37,059 | 1,865 | 5.30% |
| 石垣 | Ishigaki | 46,489 | 48,927 | 2,438 | 5.24% |
| 大村 | Omura | 89,650 | 94,344 | 4,694 | 5.24% |
| 川崎 | Kawasaki | 1,373,630 | 1,445,484 | 71,854 | 5.23% |
| 藤沢 | Fujisawa | 402,628 | 423,246 | 20,618 | 5.12% |
| 八千代 | Yachiyo | 184,655 | 194,101 | 9,446 | 5.12% |
| 松江 | Matsue | 195,875 | 205,725 | 9,850 | 5.03% |
| 安城 | Anjo | 176,046 | 184,892 | 8,846 | 5.02% |
| 生駒 | Ikoma | 115,359 | 121,013 | 5,654 | 4.90% |
| 鎌ケ谷 | Kamagaya | 104,564 | 109,562 | 4,998 | 4.78% |
| 気仙沼 | Kesennuma | 64,578 | 67,657 | 3,079 | 4.77% |
| 越谷 | Koshigaya | 318,592 | 333,736 | 15,144 | 4.75% |
| 大和 | Yamato | 223,127 | 233,586 | 10,459 | 4.69% |
| 北名古屋 | Kitanagoya | 80,112 | 83,846 | 3,734 | 4.66% |
| 新座 | Niiza | 155,926 | 163,153 | 7,227 | 4.63% |
| さくら | Sakura | 42,403 | 44,362 | 1,959 | 4.62% |
| 芦屋 | Ashiya | 92,828 | 97,096 | 4,268 | 4.60% |
| 鹿嶋 | kashima | 65,193 | 68,142 | 2,949 | 4.52% |
| 和泉 | Izumi | 179,352 | 187,434 | 8,082 | 4.51% |
| 柏 | Kashiwa | 389,036 | 406,281 | 17,245 | 4.43% |
| 太宰府 | Dazaifu | 68,561 | 71,586 | 3,025 | 4.41% |
| 袖ヶ浦 | Sodegaura | 59,443 | 62,022 | 2,579 | 4.34% |
| 草津 | Kusatsu | 123,512 | 128,843 | 5,331 | 4.32% |
| 習志野 | Narashino | 159,758 | 166,523 | 6,765 | 4.23% |
| 春日 | Kasuga | 107,845 | 112,372 | 4,527 | 4.20% |
| 大津 | Otsu | 329,024 | 342,832 | 13,808 | 4.20% |
| 下松 | Kudamatsu | 54,026 | 56,280 | 2,254 | 4.17% |
| 茅ヶ崎 | Chigasaki | 231,005 | 240,428 | 9,423 | 4.08% |
| 川越 | Kawagoe | 335,693 | 349,378 | 13,685 | 4.08% |
| 綾瀬 | Ayase | 82,083 | 85,414 | 3,331 | 4.06% |
| 尾張旭 | Owariasahi | 79,197 | 82,359 | 3,162 | 3.99% |
| 行橋 | Yukuhashi | 70,064 | 72,840 | 2,776 | 3.96% |
| 福岡 | Fukuoka | 1,430,371 | 1,486,314 | 55,943 | 3.91% |
| 瑞穂 | Mizuho | 51,230 | 53,225 | 1,995 | 3.89% |
| 伊丹 | Itami | 194,488 | 201,912 | 7,424 | 3.82% |
| 太田 | Ota | 214,049 | 222,130 | 8,081 | 3.78% |
| 富士見 | Fujimi | 105,286 | 109,164 | 3,878 | 3.68% |
| 宮古島 | Miyakojima | 52,777 | 54,706 | 1,929 | 3.66% |
| 東根 | Higashine | 46,141 | 47,797 | 1,656 | 3.59% |
| 佐倉 | Sakura | 171,472 | 177,601 | 6,129 | 3.57% |
| 能美 | Nomi | 48,106 | 49,818 | 1,712 | 3.56% |
| 豊中 | Toyonaka | 387,269 | 401,007 | 13,738 | 3.55% |
| 筑紫野 | Chikushino | 98,914 | 102,421 | 3,507 | 3.55% |
| 岩出 | Iwade | 51,843 | 53,677 | 1,834 | 3.54% |
| 伊勢崎 | Isesaki | 204,240 | 211,297 | 7,057 | 3.46% |
| 知立 | Chiryu | 68,216 | 70,555 | 2,339 | 3.43% |
| 水戸 | Mito | 264,062 | 273,046 | 8,984 | 3.40% |
| 東村山 | Higashimurayama | 146,585 | 151,412 | 4,827 | 3.29% |
| 春日井 | Kasugai | 300,713 | 310,495 | 9,782 | 3.25% |
| 日高 | Hidaka | 55,454 | 57,249 | 1,795 | 3.24% |
| 海老名 | Ebina | 126,035 | 130,077 | 4,042 | 3.21% |
| 小牧 | Komaki | 149,060 | 153,744 | 4,684 | 3.14% |
| 草加 | Soka | 237,964 | 245,389 | 7,425 | 3.12% |
| 町田 | Machida | 413,786 | 426,648 | 12,862 | 3.11% |
| 弥富 | Yatomi | 43,145 | 44,481 | 1,336 | 3.10% |
| 那覇 | Naha | 314,162 | 323,184 | 9,022 | 2.87% |
| 一宮 | Ichinomiya | 375,939 | 386,538 | 10,599 | 2.82% |
| 蕨 | Warabi | 70,410 | 72,317 | 1,907 | 2.71% |
| 美濃加茂 | Minokamo | 53,988 | 55,433 | 1,445 | 2.68% |
| ひたちなか | Hitachinaka | 155,338 | 159,480 | 4,142 | 2.67% |
| 丸亀 | Marugame | 110,550 | 113,481 | 2,931 | 2.65% |
| 武蔵野 | Musashino | 138,516 | 142,138 | 3,622 | 2.61% |
| 高松 | Takamatsu | 418,557 | 429,276 | 10,719 | 2.56% |
| 西東京 | Nishitokyo | 193,350 | 198,267 | 4,917 | 2.54% |
| 千葉 | Chiba | 938,695 | 962,376 | 23,681 | 2.52% |
| 那須塩原 | Nasushiobara | 115,633 | 118,516 | 2,883 | 2.49% |
| 宇都宮 | Utsunomiya | 507,833 | 520,462 | 12,629 | 2.49% |
| 赤磐 | Akaiwa | 43,742 | 44,827 | 1,085 | 2.48% |
| 大分 | Oita | 467,267 | 478,792 | 11,525 | 2.47% |
| 岡崎 | Okazaki | 371,380 | 380,537 | 9,157 | 2.47% |
| 府中 | Fuchu | 248,445 | 254,551 | 6,106 | 2.46% |
| 刈谷 | Kariya | 145,117 | 148,669 | 3,552 | 2.45% |
| 名護 | Nago | 60,598 | 62,081 | 1,483 | 2.45% |
| 上尾 | Ageo | 222,479 | 227,897 | 5,418 | 2.44% |
| 逗子 | Zushi | 58,654 | 60,070 | 1,416 | 2.41% |
| 茨木 | Ibaraki | 272,240 | 278,782 | 6,542 | 2.40% |
| 倉敷 | Kurashiki | 472,452 | 483,722 | 11,270 | 2.39% |
| 福山 | Fukuyama | 461,368 | 472,354 | 10,986 | 2.38% |
| 袋井 | Fukuroi | 85,163 | 87,163 | 2,000 | 2.35% |
| 調布 | Chofu | 219,053 | 224,191 | 5,138 | 2.35% |
| 仙台 | Sendai | 1,029,552 | 1,053,509 | 23,957 | 2.33% |
| 吹田 | Suita | 354,600 | 362,845 | 8,245 | 2.33% |
| 各務原 | Kakamigahara | 145,126 | 148,486 | 3,360 | 2.32% |
| 京田辺 | Kyotanabe | 65,211 | 66,697 | 1,486 | 2.28% |
| 羽島 | Hashima | 67,167 | 68,695 | 1,528 | 2.27% |
| 鯖江 | Sabae | 67,430 | 68,963 | 1,533 | 2.27% |
| 浦安 | Urayasu | 159,312 | 162,914 | 3,602 | 2.26% |
| 古賀 | Koga | 57,084 | 58,370 | 1,286 | 2.25% |
| 鎌倉 | Kamakura | 173,588 | 177,458 | 3,870 | 2.23% |
| 小山 | Oyama | 162,283 | 165,842 | 3,559 | 2.19% |
| 佐世保 | Sasebo | 254,650 | 260,110 | 5,460 | 2.14% |
| 那珂 | Naka | 54,618 | 55,779 | 1,161 | 2.13% |
| 広島 | Hiroshima | 1,163,806 | 1,188,398 | 24,592 | 2.11% |
| 野洲 | Yasu | 49,821 | 50,867 | 1,046 | 2.10% |
| 松戸 | Matsudo | 477,603 | 487,376 | 9,773 | 2.05% |
| 川西 | Kawanishi | 157,461 | 160,676 | 3,215 | 2.04% |
| 宗像 | Munakata | 94,877 | 96,806 | 1,929 | 2.03% |
| 四日市 | Yokkaichi | 306,584 | 312,753 | 6,169 | 2.01% |
| 小金井 | Koganei | 115,116 | 117,427 | 2,311 | 2.01% |
| 立川 | Tachikawa | 175,639 | 179,090 | 3,451 | 1.96% |
| 本巣 | Motosu | 34,729 | 35,405 | 676 | 1.95% |
| 白山 | Hakusan | 110,563 | 112,692 | 2,129 | 1.93% |
| 廿日市 | Hatsukaichi | 115,184 | 117,312 | 2,128 | 1.85% |
| 明石 | Akashi | 292,162 | 297,547 | 5,385 | 1.84% |
| 鈴鹿 | Suzuka | 197,437 | 201,035 | 3,598 | 1.82% |
| 和光 | Wako | 78,575 | 79,992 | 1,417 | 1.80% |
| 筑後 | Chikugo | 48,281 | 49,146 | 865 | 1.79% |
| 小郡 | Ogori | 58,460 | 59,507 | 1,047 | 1.79% |
| あきる野 | Akiruno | 80,268 | 81,697 | 1,429 | 1.78% |
| 泉佐野 | Izumisano | 99,636 | 101,343 | 1,707 | 1.71% |
| 座間 | Zama | 127,582 | 129,767 | 2,185 | 1.71% |
| 北杜 | Hokuto | 47,754 | 48,543 | 789 | 1.65% |
| 長野 | Nagano | 378,204 | 384,428 | 6,224 | 1.65% |
| 可児 | Kani | 99,318 | 100,944 | 1,626 | 1.64% |
| 国立 | Kunitachi | 73,362 | 74,558 | 1,196 | 1.63% |
| 彦根 | Hikone | 110,945 | 112,750 | 1,805 | 1.63% |
| 野田 | Noda | 153,422 | 155,900 | 2,478 | 1.62% |
| 総社 | Soja | 66,789 | 67,867 | 1,078 | 1.61% |
| 安曇野 | Azumino | 97,084 | 98,630 | 1,546 | 1.59% |
| 坂戸 | Sakado | 99,680 | 101,219 | 1,539 | 1.54% |
| 長岡京 | Nagaokakyo | 79,031 | 80,222 | 1,191 | 1.51% |
| 千歳 | Chitose | 94,124 | 95,532 | 1,408 | 1.50% |
| 山口 | Yamaguchi | 192,008 | 194,875 | 2,867 | 1.49% |
| 堺 | Sakai | 835,333 | 847,719 | 12,386 | 1.48% |
| 防府 | Hofu | 116,393 | 118,110 | 1,717 | 1.48% |
| 結城 | Yuki | 52,065 | 52,830 | 765 | 1.47% |
| 中津 | Nakatsu | 84,179 | 85,378 | 1,199 | 1.42% |
| 桑名 | Kuwana | 140,816 | 142,808 | 1,992 | 1.41% |
| 和歌山 | Wakayama | 372,175 | 377,208 | 5,033 | 1.35% |
| 西宮 | Nishinomiya | 477,056 | 483,455 | 6,399 | 1.34% |
| 所沢 | Tokorozawa | 338,560 | 343,083 | 4,523 | 1.34% |
| 御殿場 | Gotemba | 88,078 | 89,231 | 1,153 | 1.31% |
| 神戸 | Kobe | 1,530,847 | 1,550,831 | 19,984 | 1.31% |
| 下野 | Shimotsuke | 59,459 | 60,235 | 776 | 1.31% |
| 直方 | Nogata | 57,319 | 58,061 | 742 | 1.29% |
| 姫路 | Himeji | 536,170 | 543,083 | 6,913 | 1.29% |
| 相模原 | Sagamihara | 706,342 | 715,145 | 8,803 | 1.25% |
| 坂井 | Sakai | 92,420 | 93,531 | 1,111 | 1.20% |
| 入間 | Iruma | 148,203 | 149,952 | 1,749 | 1.18% |
| 清瀬 | Kiyose | 73,518 | 74,374 | 856 | 1.16% |
| 江南 | Konan | 100,064 | 101,204 | 1,140 | 1.14% |
| 知多 | Chita | 84,782 | 85,742 | 960 | 1.13% |
| 札幌 | Sapporo | 1,914,434 | 1,936,016 | 21,582 | 1.13% |
| 摂津 | Settsu | 84,330 | 85,275 | 945 | 1.12% |
| 加古川 | Kakogawa | 267,631 | 270,589 | 2,958 | 1.11% |
| 狛江 | Komae | 78,237 | 79,096 | 859 | 1.10% |
| 小城 | Ogi | 45,516 | 46,003 | 487 | 1.07% |
| 神栖 | Kamisu | 93,538 | 94,520 | 982 | 1.05% |
| 甲斐 | Kai | 74,077 | 74,811 | 734 | 0.99% |
| 藤井寺 | Fujiidera | 65,892 | 66,542 | 650 | 0.99% |
| 一関 | Ichinoseki | 123,155 | 124,344 | 1,189 | 0.97% |
| 東久留米 | Higashikurume | 115,405 | 116,494 | 1,089 | 0.94% |
| 三田 | Sanda | 113,600 | 114,628 | 1,028 | 0.90% |
| 尼崎 | Amagasaki | 461,202 | 465,236 | 4,034 | 0.87% |
| 昭島 | Akishima | 111,763 | 112,727 | 964 | 0.86% |
| 由布 | Yufu | 35,298 | 35,594 | 296 | 0.84% |
| 南アルプス | Minamiarupusu | 72,295 | 72,900 | 605 | 0.84% |
| 日野 | Hino | 179,482 | 180,975 | 1,493 | 0.83% |
| かほく | Kahoku | 34,747 | 35,030 | 283 | 0.81% |
| 稲沢 | Inazawa | 137,475 | 138,526 | 1,051 | 0.76% |
| 半田 | Handa | 117,927 | 118,783 | 856 | 0.73% |
| 三鷹 | Mitaka | 180,797 | 182,092 | 1,295 | 0.72% |
| 寝屋川 | Neyagawa | 239,029 | 240,653 | 1,624 | 0.68% |
| 静岡 | Shizuoka | 710,944 | 715,752 | 4,808 | 0.68% |
| 岡山 | Okayama | 701,293 | 706,027 | 4,734 | 0.68% |
| 桶川 | Okegawa | 74,703 | 75,207 | 504 | 0.67% |
| 岐阜 | Gifu | 412,779 | 415,520 | 2,741 | 0.66% |
| 横浜 | Yokohama | 3,697,894 | 3,722,250 | 24,356 | 0.66% |
| 土浦 | Tsuchiura | 143,986 | 144,927 | 941 | 0.65% |
| 小平 | Kodaira | 185,829 | 186,958 | 1,129 | 0.61% |
| 古河 | Koga | 144,392 | 145,214 | 822 | 0.57% |
| 市川 | Ichikawa | 470,149 | 472,757 | 2,608 | 0.55% |
| 鹿児島 | Kagoshima | 605,196 | 608,240 | 3,044 | 0.50% |
| 豊橋 | Toyohashi | 377,045 | 378,890 | 1,845 | 0.49% |
| 国分寺 | Kokubunji | 118,801 | 119,379 | 578 | 0.49% |
| 米子 | Yonago | 149,140 | 149,857 | 717 | 0.48% |
| 松山 | Matsuyama | 515,068 | 517,462 | 2,394 | 0.46% |
| 宇土 | Uto | 37,897 | 38,071 | 174 | 0.46% |
| 日向 | Hyuga | 63,066 | 63,347 | 281 | 0.45% |
| 伊豆の国 | Izunokuni | 49,711 | 49,904 | 193 | 0.39% |
| 西条 | Saijo | 112,543 | 112,959 | 416 | 0.37% |
| 春日部 | Kasukabe | 236,854 | 237,723 | 869 | 0.37% |
| 高槻 | Takatsuki | 354,228 | 355,515 | 1,287 | 0.36% |
| 豊田 | Toyota | 420,286 | 421,701 | 1,415 | 0.34% |
| 久留米 | Kurume | 305,147 | 306,173 | 1,026 | 0.34% |
| 帯広 | Obihiro | 168,188 | 168,753 | 565 | 0.34% |
| 枚方 | Hirakata | 406,201 | 407,528 | 1,327 | 0.33% |
| 恵庭 | Eniwa | 68,754 | 68,956 | 202 | 0.29% |
| 菊川 | Kikugawa | 47,702 | 47,837 | 135 | 0.28% |
| 市原 | Ichihara | 279,591 | 280,340 | 749 | 0.27% |
| 交野 | Katano | 77,853 | 78,055 | 202 | 0.26% |
| 香南 | Konan | 34,084 | 34,161 | 77 | 0.23% |
| 阪南 | Hannan | 56,853 | 56,975 | 122 | 0.21% |
| 苫小牧 | Tomakomai | 173,761 | 174,064 | 303 | 0.17% |
| 伊東 | Ito | 72,038 | 72,134 | 96 | 0.13% |
| 小美玉 | Omitama | 52,834 | 52,896 | 62 | 0.12% |
| 小野 | Ono | 49,664 | 49,707 | 43 | 0.09% |
| 大阪 | Osaka | 2,668,586 | 2,670,766 | 2,180 | 0.08% |
| 橿原 | Kashihara | 124,679 | 124,779 | 100 | 0.08% |
| 厚木 | Atsugi | 225,163 | 225,342 | 179 | 0.08% |
| 鶴ヶ島 | Tsurugashima | 70,131 | 70,184 | 53 | 0.08% |
| 都城 | Miyakonojo | 169,384 | 169,461 | 77 | 0.05% |
| 砺波 | Tonami | 49,396 | 49,406 | 10 | 0.02% |
| 射水 | Imizu | 94,691 | 94,701 | 10 | 0.01% |
- Source: Local Administration Bureau, Ministry of Internal Affairs and Communications.
- Camparison and table by Nippon Tradings International
A healthy portfolio mix would consist of approximately 60-80% "safer" (and slightly lower yielding) properties of the first type, with the rest of the portfolio consisting of more "adventurous" and potentially higher yielding properties of the second type - the actual mix would depend on the investor's risk appetite, and the composition of their investment portfolio in other countries or market sectors.
This may come as a surprise to some, but in reality, some of Japan's fastest growing metropolitan centers are virtually unknown - Tokyo, for instance, is not in the top three locations at all. The table above, updated as of 2015, is sorted by annual growth percentage, and including only those areas where this number is positive. And while there are some unique cases in which we would invest in a city which doesn't appear in this list, we would normally not stray too far from it. And there's really no need to, since, as you can see, this list provides more than enough opportunity for the savvy investor to build a robust, geographically and socio-economically diverse Japanese property investment portfolio.